
Before we begin, please remember that I am not a professorial-level expert on this subject, so what I have to say here is merely my opinion, which I think is worth adding into the discussion of this complicated subject, but which, I must admit, cannot be the last word.
NORMAL
In health-related fields, “normal” is not a single number. It is a reference range or reference interval, against which a health professional can compare a urine, blood or other test result in order to decide whether it is, or is not, within “normal limits”.
Calculation of a “normal” curve is simple for a mathematician, but complicated for most of us, as you will gather from Figure 1:
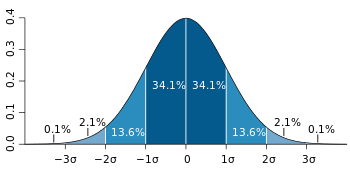
” When we assume a normal distribution, the reference range is obtained by measuring the values in a reference group and subtracting a “standard deviation” on either side of the mean. This leaves the values found in ~ 95% of the test population.
The 95% interval can be estimated by assuming a normal distribution of the measured parameter, in which case it can be defined as the interval limited by 1.96[3] (often rounded up to 2) standard deviations from either side of the mean (the expected value).
Be that as it may, in the real world neither the population mean nor the population standard deviation are known.
They both need to be estimated from a sample, whose size can be designated n.
The population standard deviation is estimated by the sample standard deviation and the population mean is estimated by the sample mean (also called mean or arithmetic mean). To account for these estimations, the 95% prediction interval (95% PI) is calculated as: 95% PI = mean ± t0.975,n−1·√(n+1)/n·sd.
……… If that sounds suspiciously complicated, don’t look at me: ask your favourite math genius for his/her usual facile explanation!
……… Suffice it that the reference range encompasses results found in 95% of a reference group taken from a healthy population.
……… There are also optimal ranges (ranges that we think indicate optimal health) and ranges for particular conditions or situations (such as pregnancy reference ranges for hormone levels).
………. My preference is for optimal ranges and I have serious doubts about the accepted “normal” ranges of quite a few tests: see below.
.…….. Caveat: the blithe acceptance of the idea that 95% of a “healthy” population will have “normal” levels for all test results is overly optimistic. This assumption is contrary to doctors’ age-old principle of “a high index of suspicion” and must lead to underdiagnosis.
…….. Therefore Caveat: since our metabolic systems are interdependent and mutually, unpredictably variable in one way or another, the individual human should not be included in a population sample for estimation of “normal” values unless his/her results are within normal limits for all other available tests. Thus, eligiblity for an estimation of normal should be denied if the BMI is suspicious, if there is any diagnosable physiological/metabolic/genetic aberration, if the chronological age is < 20 or > 25 or if the psychological balance is suspect.
DON’T CONFUSE “NATURAL” WITH “NORMAL”
NATURAL NORMAL: Many systems change over time and the tendency of our “gurus” is to modify “normal” according to age.
Consider “natural normal” for DHEA (in micro-moles Litre), calculated as:
| Age | Female | Male | |
| Newborn | 4.5 – 10 | 4.5-10 | Mother gives her baby quite a lot |
| 01-12 Yr | < 5.0 | < 5.0 | We don’t make much DHEA as kids |
| 13-29 Yr | < 11 | < 11 | Just before puberty, production spikes * |
| 30-39 Yr | <7.3 | <14 | Femmes slow output at age 25 |
| 40-49 Yr | <6.5 | <14 | Males usually keep it up through 45 |
| 50-59 Yr | <5.4 | <8.4 | By 50, the ladies are in real trouble ** |
| 60-69 Yr | <3.5 | <7.9 | By 65, the men are in the same boat ** |
| 70-79 Yr | <2.4 | <4.7 | At 70, we are all over the hill |
| 80-99 Yr | ?? 0.0 | ?? 0.0 | At 80, only the brain makes DHEA ** |
** I have observed that symptoms start when DHEA falls below 5.0 µMol/Litre, in both males and females.
*** Only the great apes, including us, make DHEA in the adrenals. The brain makes it for its own use and in lesser animals, is the only source of this all-important prohormone.
CLEARLY, THIS SCHEDULE TELLS US SEVERAL THINGS:
[1] males produce more DHEA than females.
[2] women begin to reduce production by age 25 and men, in their 40s.
[3] production is at infant levels or less by 60 and by 80, is close to zero.
[4] the researcher of the DHEA range didn’t know what the lower limits are.
[5] if DHEA is important, the human race has a problem.
[6] failing production is natural, but not normal, as we age.
Consider “natural normal” for Thyroid hormone (picoMoles/Litre).
In 2005 Leonard Wartofsky and Richard A Dickey wrote, (paraphrased) It has become clear that our reference ranges are no longer valid. We have more sensitive TSH tests and also, we now realise that previous reference populations included people with (low) thyroid dysfunction, whose high TSH levels led to a spuriously high reference range for TSH in the group. Recent laboratory guidelines from the National Academy of Clinical Biochemistry indicate that more than 95% of normal individuals have TSH levels below 2.5 mU/liter.
(2) In 2007 Martin I. Surks and Joseph G. Hollowell said as follows (paraphrased)……
The TSH median, 97.5 centile and prevalence of subclinical hypothyroidism (SCH) increase progressively with age. Age-adjusted reference ranges would include many people with TSH greater than 4.5 mIU/liter.
They continued: ”Without thyroid disease”, 10.6% of 20- to 29-yr-olds had TSH greater than 2.5 mIU/liter.” *
In the 80+ year-old group “without thyroid disease”, 14.5% had TSH greater than 4.5 mIU/liter.
TSH frequency distribution curves of the 80+ year-old group showed higher TSH.
The 97.5 centiles for the 20–29 and 80+ year-old groups were 3.56 and 7.49 mIU/litre, respectively.
70% of older patients with TSH greater than 4.5 mIU/liter were within their age-specific reference range (up to 7.49)**.
In spite of these findings (almost 100% of) our medical doctors preferred to think like Surks and Hollowell and the reference range for TSH has remained unchanged. ***
However to me, the implications are clear:
(A) Wartofsky and Dickey were correct and the upper limit of normal TSH should be 2.5, but they should have realised that 10.6% of their 20-29-year-olds were in fact, hypothyroid and should have excluded them. ****
(B) Surks and Hollowell would have done better to label the older folks hypothyroid, rather than concluding that “high TSH is normal for the older population”: what their findings mean to me is that a large percentage of the 80+-year-olds were hypothyroid and should have been exclude from their calculation of normal.
(C) “AGE-SPECIFIC NORMAL”, or “NATURAL NORMAL” makes no sense. “Normal” should be understood to mean the status of healthy humans aged 20-25 and an abnormal finding for any test should disqualify the candidate for all estimates of “normal”.
* This implies that 10.6% of the 20-29-year-olds were hypothyroid and should not have been included in a calculation of “normal”: .
** Any result >2.5 suggests hypothyroidism, so this implies that more than 14.5% of the 80+ – year olds were hypothyroid: including them in the “normal” group means that 15+% of 80-yr-olds won’t get the treatment they need !
*** I dare suggest that you should apply fair logic to every paper you read, so as to exclude glaring errors and prejudices such as these from your belief systems.
**** Think about it – if I am right, since the thyroid hormone dictates the efficiency level of every cell and system in the body, and if 10.6% (or more) of the thyroid test study population should have been excluded from the calculation of “normal” thyroid hormone levels, then the parameters for all our other tests could be wrong and maybe a lot of tests might be invalid !
MESSAGE
– Many other hormones suffer the same fate as DHEA: Melatonin, Progesterone, Allopregnanolone, Testosterone and Thyroid hormone all go down over time, mostly by slow, gradual loss of production.
– In some people several hormone levels can “crash” suddenly, causing various symptoms of deficiency depending on which hormones are involved. This can happen with Melatonin in the “teens”, Progesterone and Allopregnanolone in the twenties, Testosterone in the thirties or earlier and particularly Oestrogen, which disappears in the early fifties but can fall to zero in the late thirties or early forties.
– Thus assesssment of “normal” in the presence of “natural age related hormonal change” is very difficult.
– To give medical investigators their due, a concerted effort is always made to include only the fittest individuls in the group evaluated. However there are instances in which unknown or ignored factors lead to a “curve ball” situation and consequent unreliability of an accepted “normal” range.
– IN SUMMARY, aberrations of hormonal production are pervasive and the interdependence of hormonal systems is delicate: test subjects should be BETWEEN AGE 20 AND 25 YEARS and ALL THEIR OTHER RESULTS SHOULD BE 100% NORMAL, for inclusion in studies to calculate a “normal” reference range for whatever test is to be evaluated.
In the next section I will consider, as examples, TSH as a stand-alone test for thyroid function and DHEA as a marker of aging.
REFERENCES
(1) The evidence for a narrower thyrotropin reference range is compelling
Leonard Wartofsky 1 , Richard A Dickey, J Clin Endocrinol Metab, 2005 Sep; 90(9):5483-8 PMID: 16148345 DOI: 10.1210/jc.2005-0455 .https://pubmed.ncbi.nlm.nih.gov/16148345/

One thought on “THINK ABOUT “NORMAL””